The VA loan program generates billions of dollars in economic value for military families, communities and U.S. GDP every year. This groundbreaking study shows how recent and future increases to the program’s guaranty fee will harm all three.
Key Findings
- VA purchase loans generate $47.3 billion economic activity and contribute $27.6 billion to GDP annually. The VA loan program supports 361,862 jobs nationwide.
- Raising the first-use VA Funding Fee by 100 basis points (1 percentage point) would push more than 100,000 first-time buyers away from using their VA loan benefit.
- A rising rate environment coupled with continued increases of the VA Funding Fee would hurt waves of military buyers and communities that depend on the economic impacts of housing. As many as 365,000 Veterans and military families would be priced out of using their home loan benefit if rates and fees keep rising.
- More than 685,000 Veterans and military members used their VA loan benefit during Fiscal Years 2016-2018, with an average loan amount of $257,077.
- CBO projections estimate $750 million in additional costs to veterans if proposed changes to the VA funding fee are passed.
Download the PDF version of the study here.
Mortgage Research Center, LLC provided financial support to conduct this study.
Executive Summary
The Department of Veterans Affairs (VA) home loan program has helped millions of veterans and their families to obtain mortgage loans to purchase homes or refinance their mortgage with lower interest rates and/or cash out. The program was designed to help veterans who might struggle to build the kind of credit and asset profile necessary to qualify for conventional mortgage loans. In addition to less stringent qualification guidelines, other benefits include no down payment, no private mortgage insurance (PMI), lower average interest rates, and limits on closing costs.
There are two types of VA loans: VA direct home loans and VA-backed home loans. U.S. Department of Veteran Affairs (VA) is the mortgage lender for VA direct home loans and is a guarantor for VA-backed home loans. The VA guaranteed loans are made by private lenders, such as banks, savings and loans, or mortgage companies. Most VA loan recipients are required to pay a funding fee, which ranges from 1.25% (first-time users with 10% down payment or more) to 3.30% (subsequent users with no down payment).
The amount of the VA funding fee is based on the following:
- Veteran’s type of service
- Type of loan
- The amount of down payment
- First or subsequent use of the VA Home Loan Guaranty
The VA funding fee can be paid in cash at closing or can be rolled into the total loan amount.
Currently, there are nearly 3.9 million active duty military and National Guard and Reserve personnel and spouses, and ADF DOD civilians. In addition, there are more than 18.2 million veterans and about half of them are between 18 and 64 years old. Overall, veterans have a higher labor participation rate and a lower unemployment rate compared to their non-veteran counterparts. Consequently, the median income of veterans is higher than that of non-veterans. More veterans are married compared to their non-veteran counterparts. These economic and demographic factors contribute to a high desire for veterans to own a home. The latest statistics show 76% of veterans are homeowners compared to 62% of non-veterans. Delinquencies and foreclosures of VA loans have been declining since 2002 and are lower than other borrowing groups in the past ten years. At its peak in 2009-10, the foreclosure rate of VA loans was about 2.6% compared to 14.3% for conventional ARM loans and around 5.0% for conventional loans.
During FY2016-2018, the number of VA-backed loans averaged 685,428 per year. Total loans amounted to more than $176.2 billion per year, averaging $257,077 per loan. Over half of VA loans (372,165 loans and $97.3 billion) were used to purchase homes, which includes existing homes and new construction. One quarter (157,938 loans and $39.5 billion) were used to refinance with lower interest rates (interest reduction rate refinance loan, IRRRL), and one quarter (155,326 loans and $39.4 billion) were used to refinance with the VA Cash Out option (which does not actually require a homeowner to take out cash; this is the only option for refinancing a non-VA loan into a VA-backed mortgage).
These loans generate significant economic activity. To calculate the total economic impacts of the VA Guaranty program on purchase loans we apply the official BEA economic multipliers to the annual average of existing and new home sales during FY2016-18. We estimate that the VA Guaranty program supports 361,862 jobs across all industries that earned $12.7 billion a year. VA purchase loans generate $47.3 billion economic activity and contribute $27.6 billion value-added to the U.S. GDP per year. (Table 1)
Table 1: The VA Guaranty program supports 361,862 jobs and $47.3 billion in economic activity per year
| - | All Homes | Existing Homes | New Home |
|---|---|---|---|
| Number of Homes | 372,165 | 310,137 | 62,027 |
| Total Loan Amount | $97.3 billion | $81.1 billion | $16.2 billion |
| Output | $47.3 billion | $10.9 billion | $36.4 billion |
| Value-Added | $27.6 billion | $7.9 billion | $20.0 billion |
| Emploment | 361,862 | 52,651 | 309,211 |
| Earnings | $12.7 billion | $1.4 billion | $11.3 billion |
During FY2016-18, VA originations averaged 685,428 per year. Assuming 80% of veteran borrowers pay VA funding fees, we estimate 548,342 VA loans include VA funding fees. Like a mortgage rate, the VA funding fee affects monthly mortgage payment and therefore the decision to purchase a home. Using the median home price and current statistics, we estimate the current VA funding fee is equivalent to an extra 60 bps to 95 bps on the mortgage rate. We also estimated the impacts of increases in VA funding fee on monthly mortgage payments. An additional 25 bps, 50 bps, and 100 bps increase in the VA funding fee would have a similar impact of an increase between 70 bps and 120 bps on the mortgage rate.
Freddie Mac estimated a 146 bps increase in mortgage rate reduced loan originations by 30%, the equivalent to a 20.5% reduction in loan originations for every 100 bps increase in the interest rate. We applied Freddie Mac’s figures to estimate the impact of the VA funding fee and changes on loan originations. Table 2 demonstrates the negative impacts of VA funding fees on VA loan originations.
We applied Freddie Mac’s figures to estimate the impact of the VA funding fee and changes on loan originations. Table 2 demonstrates the negative impacts of VA funding fees on VA loan originations.
The current VA funding fee for first-time military borrowers with no down payment (2.15%) reduces VA loan originations by 67,604. If the VA funding fee increases by 100 bps to 3.15%, it would reduce VA loan originations by 101,406 for first-time military home buyers with no down payment.
In other words, a one-time 100 bps increase of the VA funding fee has a similar impact of a 90 bps increase in interest rate, which in turn would reduce loan originations by 33,802 (101,406 – 67,604). (Table 2)
Homebuyers Aren't the Only Ones Affected
Real estate agents would see a potential loss of $1.17 billion in commissions (101,406 x .89[1] x 257,077[2] x .0508[3])
1) According to the National Association of Realtors, in 2018 91% of home sellers and 87% of home buyers used an agent - or 89% on average.
2) The average VA loan amount in 2018.
3) According to Real Trends, the average agent commission in 2018 was 5.08%.
Table 2: Reduction in loan originations under the Status-quo scenario
| - | Base-Case | +25 bps | +50 bps | +100 bps |
|---|---|---|---|---|
| Military | ||||
| - First-time, no down payment | 67,604 | 78,871 | 84,505 | 101,406 |
| - Subsequent, no down payment | 107,039 | 112,673 | 123,940 | 135,208 |
| Reserves/National Guard | ||||
| - First-time, no down payment | 78,871 | 84,505 | 96,772 | 107,039 |
| - Subsequent, no down payment | 107,039 | 112,673 | 123,940 | 135,208 |
The negative impact of rising VA funding fees on VA loan originations is more significant in the environment where interest rates are going up. Freddie Mac expects that 30-year mortgage rates will rise by 146 bps during a 13-month period in its Average scenario. We estimate the current 2.15% VA funding fee under this scenario would reduce loan originations of first-time users by 232,107. If the VA raises the funding fee by 100 bps to 3.15%, we estimate loan originations will be reduced by 265,909. (Table 3)
Table 3: Reduction in loan originations under the Average scenario
| - | Base-Case | +25 bps | +50 bps | +100 bps |
|---|---|---|---|---|
| Military | ||||
| - First-time, no down payment | 232,107 | 243,347 | 249,008 | 265,909 |
| - Subsequent, no down payment | 271,542 | 277,176 | 288,443 | 299,711 |
| Reserves/National Guard | ||||
| - First-time, no down payment | 243,374 | 249,008 | 260,270 | 271,542 |
| - Subsequent, no down payment | 271,542 | 277,176 | 288,438 | 299,711 |
Freddie Mac’s Severe scenario expects that mortgage rates will increase by 238 bps within a 14-month period. We estimated the current 2.15% VA funding fee under this scenario would reduce loan originations of first-time users by 335,766. If the VA raises the funding fee by 100 bps to 3.15%, we estimated loan originations of first-time and no down payment home buyers will be reduced by 369,568. (Table 4)
Table 4: Reduction in loan originations under the Severe scenario
| - | Base-Case | +25 bps | +50 bps | +100 bps |
|---|---|---|---|---|
| Military | ||||
| - First-time, no down payment | 375,766 | 347,033 | 352,667 | 369,568 |
| - Subsequent, no down payment | 375,202 | 380,835 | 392,103 | 403,370 |
| Reserves/National Guard | ||||
| - First-time, no down payment | 347,033 | 352,667 | 363,934 | 375,202 |
| - Subsequent, no down payment | 375,202 | 380,835 | 392,103 | 403,370 |
Although veteran borrowers historically have lower default and foreclosure rates than their non-veteran counterparts, policy proposals to increase the VA funding fees will hurt veterans. This report quantifies the positive economic benefits of the program on veterans, their families, and the U.S. economy. An increase in VA funding fees would have significant negative impacts on VA loan originations and other economic activities sparked by home purchases. Under the current environment of rising interest rates, an increase in the VA funding fee schedule would have severe negative impacts on veterans, their families, and the U.S. economy.
VA Guaranty Program, Veteran Homeownership, and VA Mortgage Loans
The Department of Veterans Affairs (VA) home loan programs has helped millions of veterans and military families since its creation in 1944. The VA Guaranty program, part of the original GI Bill, was created to assist veterans and their families in purchasing homes or refinancing their mortgage with lower interest rates and/or cash out. The VA does not make home loans. Rather, it provides a financial guaranty to private VA-approved lenders. This insurance gives lenders confidence to extend financing along with some significant financial benefits.
Veterans have higher labor participation rates and lower unemployment rates than their non-veteran counterparts. Education attainment of veterans is also higher than non-veterans. Consequently, the median incomes of both male and female veterans are higher than their non-veteran counterparts. A larger share of male and female veterans is married than their non-veteran counterparts.
With a combination of higher income, a lower unemployment rate, and larger share of married couples, the homeownership rate of veterans is higher than their non-veteran counterparts. Notably, the delinquency and foreclosure rates of veterans are also lower than that of other economic and demographic groups in the past decade.
VA Guaranty Program
Veterans are often not qualified for conventional mortgage loans due to a lack of credit history and available cash for down payments. The VA Guaranty program offers veterans a path to homeownership when they would not otherwise have the opportunity. Several main benefits of the program include:
- No down payment
- No private mortgage insurance (PMI), which is typically required for down payments less than 20%
- Lower average interest rates
- Less stringent qualification guidelines
- Lower closing costs
Types of VA Loans. There are two types of VA loans: VA direct home loan and VA-backed home loan. U.S. Department of Veteran Affairs (VA) is the mortgage lender for VA direct home loans and is a guarantor for VA-backed home loans. VA guaranteed loans are made by private lenders, such as banks, savings and loans, or mortgage companies. These loans are made to eligible veterans to purchase a primary residence. The guaranty means the lender is protected against a portion of the loss if the borrower fails to repay the loan. The guaranty replaces the protection the lender normally receives from the down payment, allowing the borrower to obtain favorable financing terms. In addition to the VA standards, private lenders often require applicants to meet additional standards such as an adequate credit score and an acceptable debt-to-income ratio. If a VA-backed home loan goes into foreclosure, the guaranty allows the lender to recover some or all of their losses. Since there is less risk for the lender, veterans are likely to receive the loan under better terms such as no down payment and no mortgage insurance. However, the majority of veteran borrowers have to pay a VA funding fee.
The two primary groups of VA loan recipients that are exempt are:
- Veterans entitled to or receiving compensation for a service-connected disability
- Surviving spouses of veterans who died in service or from a service-connected disability.[2]
Funding Fee Schedule. The amount of the VA funding fee is based on the veteran’s type of service, the type of loan, the amount of down payment, and first or subsequent use of the VA Guaranty program.
The VA funding fee can be paid one time at closing or can be rolled into the total loan amount. The schedule of VA funding fee as of 2019 is below.[3] (Table 5, Panel A) In June 2019, Congress passed and the President signed the Blue Water Navy Vietnam Veterans Act of 2019, which extended the presumption of service connection for illnesses due to Agent Orange exposure for certain Vietnam-era Veterans. This bill also increased several VA funding fees for 2020 and 2021 as a pay-for of these benefits under the Statutory Pay-As-You-Go Act. Furthermore, the bill set similar funding fee rates for all regular military, National Guard, and Reserve personnel. Under this new law, regular military personnel will have to pay an additional between 15 bps and 30 bps during 2020 and 2021. (Table 5, Panel B)[4]
Table 5: Panel A. The VA Guaranty program fee varies across veteran borrowers, as of 2019 [5]
| - | Down Payment | First-Time Use | Subsequent Use |
|---|---|---|---|
| Military | 0% - 4.9% | 2.15% | 3.30% |
| - First-time, no down payment | 5% - 9.9% | 1.50% | 1.50% |
| - Subsequent, no down payment | 10% or more | 1.25% | 1.25% |
| Reserves/National Guard | 0% - 4.9% | 2.40% | 3.30% |
| - First-time, no down payment | 5% - 9.9% | 1.75% | 1.75% |
| - Subsequent, no down payment | 10% or more | 1.50% | 1.50% |
Table 5: Panel B. The VA Guaranty program fee for 2020-2021 (expected) [6]
| Type of Service | Down Payment | First-Time Use | Subsequent Use |
|---|---|---|---|
| Regular Military Personnel and Reserves/National Guard | 0% - 4.9% | 2.30% | 3.60% |
| - | 5% - 9.9% | 1.65% | 1.65% |
| - | 10% or more | 1.4% | 1.4% |
VA does not set a cap on the loan. However, there are limits on the amount of liability the VA can assume. The loan limits are the amount a qualified veteran can borrow without making a down payment. The VA’s 2019 loan limits are the same as the Federal Housing Finance Agency’s one-unit limits.
Active Duty Military and Veteran Demographics
There are nearly 3.9 million military and National Guard and Reserve personnel and spouses and Department of Defense Appropriated Fund (APF) civilian personnel. In addition, there are over 18.2 million veterans at all ages. (Table 6) Overall, veterans have a higher employment participation rate and lower unemployment rate compared to their non-veteran counterparts. Consequently, the median income of veterans is higher than that of non-veterans. More male and female veterans are married compared to their non-veteran counterparts. These economic and demographic factors contribute to a high desire for veterans to own a home. The latest statistics show 76% of veterans are homeowners compared to 62% of non-veterans.[7]
Table 6: There are nearly 3.9 active duty personnel and spouses and over 18.2 million veterans [8]
| - | Number of People |
|---|---|
| Active Duty Military Personnel | 1,339,049 |
| National Guard and Reserve | 799,007 |
| ADF DOD Civilian | 744,005 |
| Active Duty Spouses | 624,000 |
| Selected Reserve/National Guard Spouses | 372,000 |
| Veterans | 18,204,605 |
Veteran Population and Labor Force. Over 9.1 million veterans and about half of all veterans, are between 18 and 64 years old. Nearly 7 million veterans participate in the labor force and 2.1 million do not. About 47% of veterans are between 35 and 54 years old, 35% are between 55 and 64 years old, and 18% are between 18 and 34 years old. (Table 7)
Table 7: More than 9.1 million veterans are between 18 and 64 years old [9]
| - | All | 18-34 | 35-54 | 55-64 |
|---|---|---|---|---|
| All Veterans | 9,117,616 | 1,613,209 | 4,286489 | 3,217,918 |
| In Labor Force | 6,970,584 | 1,322,815 | 3,634,144 | 2,013,625 |
| - Employed | 6,665,671 | 1,241,435 | 3,498,014 | 1,926,222 |
| - Unemployed | 304,913 | 81,380 | 136,130 | 87,403 |
| Not in Labor Force | 2,147,032 | 290,394 | 652,345 | 1,204,293 |
More veterans participate in the labor force than their non-veteran counterparts, especially veterans who are between 18 and 54 years old. About 82% of veterans between 18 and 34 years old participate in the labor force compared to 76.5% of non-veterans, a 5.5 percentage point difference. Veterans between 35 and 54 years old also have higher labor participation rate than their non-veteran counterparts, 84.8% compared to 81.3%. However, the labor participation rate of veterans between 55 and 64 years old is 2.5 percentage points lower than that of the non-veteran group at the same age group. Veterans also have a lower unemployment rate than their non-veteran counterparts. In 2017, the unemployment rate of veterans was 4.4% compared to 5.3% of their non-veteran counterparts. The unemployment rate of veterans between 18 and 34 years old was noticeably lower than that of non-veterans, 6.2% compared to 7.5%. (Table 8)
Table 8: Veterans have a higher labor participation rate and lower unemployment rate [10]
| - | All | 18-34 | 35-54 | 55-64 |
|---|---|---|---|---|
| Labor Force Participation Rate | ||||
| - Veterans | 76.5% | 82.0% | 84.8% | 62.6% |
| - Non-Veterans | 76.2% | 76.5% | 81.3% | 65.1% |
| Unemployment Rate | ||||
| - Veterans | 4.4$ | 6.2% | 3.7% | 4.3% |
| -Non-Veterans | 5.3% | 7.5% | 4.0% | 3.4% |
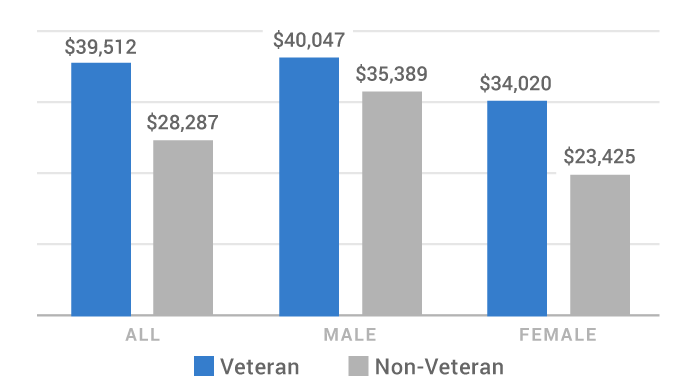
Income. Veterans have higher incomes than their non-veteran counterparts. The median income of veterans during 2013-17 was nearly 40% higher than the median income of non-veterans, $39,512 for veterans compared to $28,287 for non-veterans (2017 dollars). While the median income of male veterans was 13.1% higher than male non-veterans, the median income of female veterans was 45.2% higher than female non-veterans. (Figure 1)
Figure 1: The median income of veterans is nearly 40% higher than their non-veteran counterparts [11]
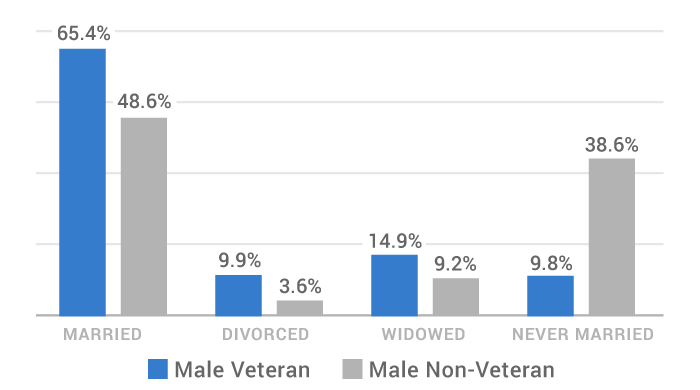
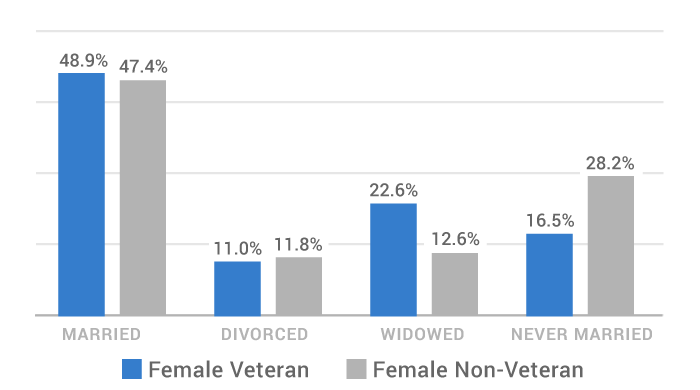
Marital Status. A higher share of veterans is married compared to their non-veteran counterparts. In 2014, 65.4% of male veterans were married compared to 48.6% of male non-veterans. Similarly, 49.9% of female veterans were married compared to 47.4% of female non-veterans. Only 9.8% of male veterans and 16.5% of female veterans have never been married compared to 38.6% and 28.2% of their male and female non-veteran counterparts, respectively. (Figure 2)
Figure 2: A higher percentage of male and female veterans are married than their non-veteran counterparts [12]
Panel A. Distribution of male veterans and non-veterans
Panel B. Distribution of female veterans and non-veterans
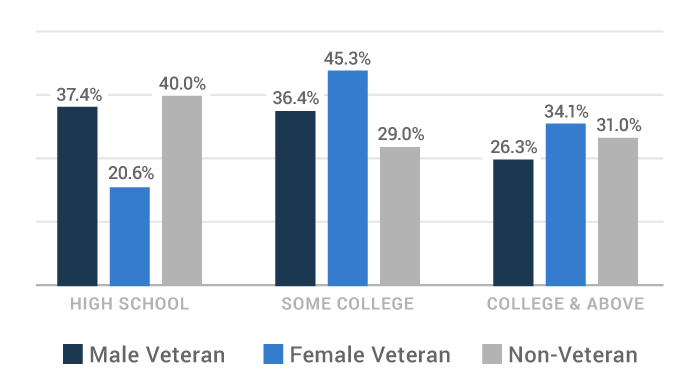
Educational Attainment. A larger percentage of veterans, especially female veterans, attained higher than high school education compared to the average for adults overall. About 45.3% of female veterans attained some college and 34.1% completed college and above, compared to 29.0% and 31.0% of all adults in the U.S., respectively. (Figure 3)
Figure 3: A higher percentage of veterans attain beyond high school education than all adults in the U.S. [13]
Veteran Homeownership
With a combination of higher income, a lower unemployment rate, and a larger share of married individuals, the homeownership rate of veterans is higher than non-veterans. Notably, the delinquency and foreclosure rates of veterans are also lower than in other economic and demographic groups.
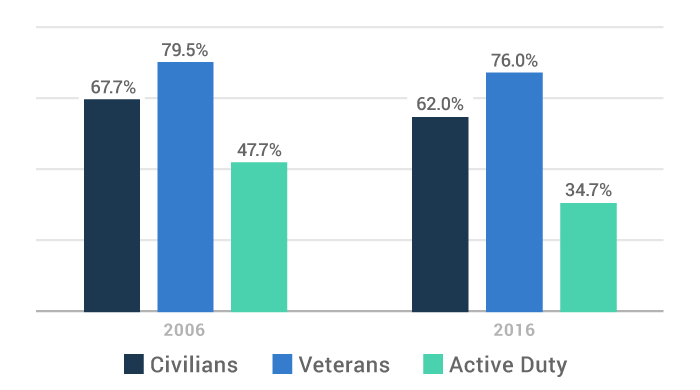
Homeownership Rates. Historically, veterans have a higher homeownership rate than civilians and active duty military personnel. At the peak of the market in 2006, the homeownership rate of veterans was 79.5% compared to 67.7% of civilians and 47.4% of active duty military. Although homeownership rates of both civilians and veterans have declined since 2006, the homeownership rate of veterans declined slower than civilians and especially active duty military. By 2016, the homeownership rate of veterans stood at 76.0% compared to 62.0% of civilians and only 34.7% of active duty military personnel. (Figure 4)
Figure 4: Homeownership rates of veterans are higher than non-veterans [14]
Did You Know?
During the past three fiscal years, the number of VA-backed loans averaged 685,428 per year at a value of $257,077 per loan. Total loans amounted more than $176.2 billion per year.[15] (Table 9)
Annual VA Loan Volume and Size. During the past three fiscal years, FY2016 to FY2018, the number of VA-backed loans averaged 685,428 per year. Total loans amounted more than $176.2 billion per year and an average $257,077 per loan.[15] (Table 9) The exact number of veterans exempted from paying the funding fee is not available. We assume 20% of VA borrowers are exempted from paying the funding fee and 80% of borrowers pay the funding fee. Using the annual average volume during FY2016-18, we estimate 548,342 VA loans included a funding fee in each year.
Table 9: The VA Guaranty program averages 685,428 mortgage loans totaling over $176.2 billion per year [16]
| - | Total VA Loans | Total Loan Amount | Average Loan Amount |
|---|---|---|---|
| FY 2016 | 705,392 | $178,636,453,834 | |
| FY 2017 | 740,381 | $188,692,800,206 | |
| FY 2018 | 610,512 | $161,295,325,718 | |
| Average FY 2016-18 | 685,428 | $176,208,193,253 | $257,077 |
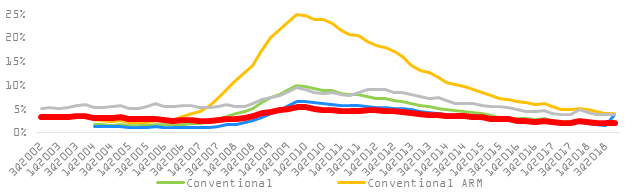
Delinquency and Foreclosure Rates. VA loans delinquencies are low and have been declining since 2010. The Mortgage Bankers Association tracks total delinquencies and serious delinquencies for different types of borrowers. Total delinquencies are reported in buckets of 30–59 days, 60–89 days, and 90 days or more, exclusive of loans in the foreclosure process. The serious delinquent rate is the non-seasonally adjusted percentage of loans that are at least 90 days delinquent or in the process of foreclosure.
In 2004, total delinquencies and serious delinquencies of VA loans were 7.0% and 3.2%, respectively. Both were lower than FHA loans but were higher than conventional ARM and fixed loans. During the peak of mortgage delinquencies in 2009, delinquencies of VA loans increased substantially less than FHA and conventional loans. In 2009, rates of total delinquencies and serious delinquencies of VA loans were lower than FHA and conventional ARM and fixed loans. Since 2009, VA delinquency rates have been declining. The VA delinquent rate has always been lower than FHA and conventional ARM loans and hovering around conventional fixed loans. (Figure 5)
Figure 5: Rates of serious delinquencies of VA loans are low and declining [17]
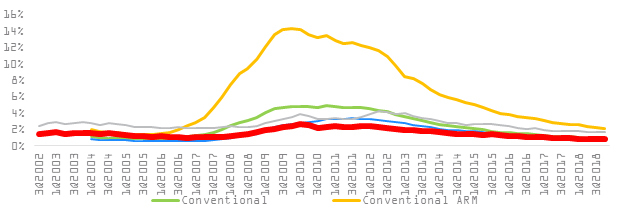
The foreclosure rate of VA loans has been declining since 2002. In fact, the foreclosure rate of VA has been dropping below foreclosure rates of conventional, conventional fixed, conventional ARM, and FHA groups in the past ten years. At its peak in 2009-10, the foreclosure rate of VA loans was about 2.6% compared to 14.3% for conventional ARM loans and around 5.0% of conventional loans. (Figure 6)
Figure 6: The foreclosure rate of VA loans is low and declining [18]
The Economic Impacts of the VA Guaranty Program on the U.S. Economy
Veterans borrow VA loans to purchase a home, refinance with a lower interest rate, or refinance and take out cash. More than half of number of loans and total loan amount were for purchasing homes.
During FY2016-18, the VA Guaranty program helped veterans with 372,165 purchase loans (310,137 existing homes and 62,027 new homes), 157,938 interest reduction loans, and 155,326 cash-out loans. We use official economic multipliers to estimate total economic impacts of VA purchase loans.
Economic Impact: By the Numbers
On average, VA purchase loans support 361,862 jobs that pay $12.7 billion per year, create $47.3 billion in economic activity, and contribute $27.6 billion value-added to the U.S. GDP a year.
Direct Impacts of the VA Guaranty Program
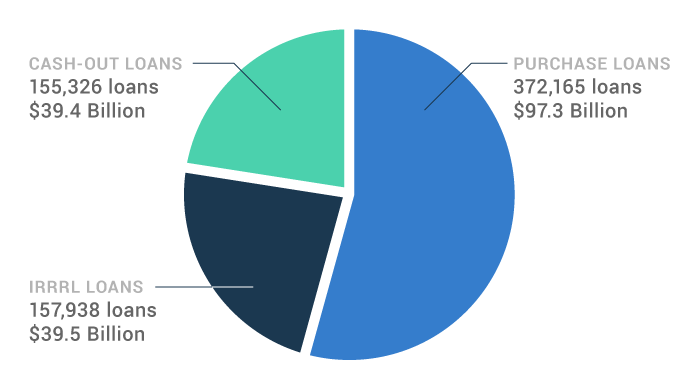
The VA Guaranty program helps veterans and their families obtain financing to buy or refinance their homes. During FY2016-18, an average of 685,428 VA loans totaling over $176.2 billion were originated each year. Over half of VA loans (372,165 loans and $97.3 billion) were used to purchase homes, one quarter (157,938 loans and $39.5 billion) were used to refinance with lower interest rates (interest reduction rate refinance loan, i.e., IRRRL), and one quarter (155,326 loans and $39.4 billion) were used to refinance with cash out. (Figure 7)
Figure 7: VA purchase loans account for over half of the VA Guaranty program [19]
Home sales include both existing homes and new homes. The National Association of Realtors (NAR) estimates one new home is built for every six existing home sales.[20] Using the NAR new-existing home ratio, we estimate the VA Guaranty program helps veterans to purchase 310,137 existing homes totaling $81.1 billion home sales and 62,027 new homes totaling $16.2 billion per year. (Table 10)
Table 10: The VA Guaranty program helps veterans purchase an average of 310,137 existing and 62,027 new homes a year [21]
| - | All Homes | Existing Homes | New Homes |
|---|---|---|---|
| Number of Homes | 372,165 | 310,137 | 62,027 |
| Total Loan Amount | $97.3 billion | $81.1 billion | $16.2 billion |
Table 11: The VA Guaranty program supports 361,862 jobs and $47.3 billion in economic activity per year
| - | All Homes | Existing Homes | New Homes |
|---|---|---|---|
| Output | $47.3 billion | $10.9 billion | $36.4 billion |
| Value-Added | $27.6 billion | $7.6 billion | $20.0 billion |
| Employment | 361,862 | 52,651 | 309,211 |
| Earnings | $12.7 billion | $1.4 billion | $11.3 billion |
The Negative Economic Impacts of Rising Funding Fees & Interest Rates on VA Mortgage Loans
Most veterans pay a funding fee to obtain VA-backed mortgage loans. Borrowers can either pay the fee up front or roll it over in the mortgage to pay on a monthly basis. The funding fee, just like a mortgage rate, negatively affects the demand for home purchasing and home prices.
Freddie Mac estimated an increase of 146 bps in mortgage rates would reduce loan originations by 30%.[24] Since the financial impact of the VA funding fee on a mortgage payment is similar to a mortgage rate, we apply Freddie Mac’s estimates to calculate the impacts of the VA funding fee on loan originations. We estimate the reduction of VA loan originations under three scenarios where the VA funding fee increases by 25 bps, 50 bps, and 100 bps.
Impacts of Rising Interest Rates on Home Markets
In February 2018, Freddie Mac analyzed data from 1990 to 2018 and concluded that mortgage originations and housing activity fall when mortgage rates increase sharply. They defined a rising interest rate environment as a period in which the monthly average of the Primary Mortgage Market Survey (PMMS) rate for 30-year fixed mortgages increased by more than 1 percentage point from trough to peak. Using its definition, Freddie Mac identified six periods of increasing rates since 1990. With two exceptions, the increasing rate environments were accompanied by reductions in mortgage originations, home sales, and housing starts across the board. [25] (Table 12)
Table 12: On average, loan originations drop by 30% when the mortgage rate increases by 146 bps [26]
| Period | Duration (Months) | Mortgage Rates (bps Change) | Home Prices (% Change) | Originations (% Change) | Home Sales (% Change) | Housing Starts % Change) |
|---|---|---|---|---|---|---|
| Oct 1993 - Dec 1994 | 14 | 238 | 3 | -49 | -11 | -13 |
| Jan 1996 - Sep 1996 | 8 | 120 | 2 | 16 | -2 | -12 |
| Oct 1998 - May 2000 | 19 | 181 | 13 | -45 | -2 | -9 |
| Jun 2003 - Jun 2004 | 12 | 106 | 13 | -42 | -2 | 0 |
| Jun 2005 - Jul 2006 | 13 | 118 | 7 | -12 | -14 | -32 |
| Nov 2012 - Dec 2013 | 13 | 111 | 11 | -46 | -5 | -2 |
| Average | 13 | 146 | 8 | -30 | -5 | -11 |
Freddie Mac also considered three scenarios for the next cycle of mortgage rates. The first “status quo” scenario is a continuation of the current environment in which 30-year fixed rates will hover between 3.5% and 4.5%. The second “average” scenario is average experience based on the market moves during the six periods since 1990. The third “severe” scenario is the most extreme movements in housing and mortgage markets during these six periods. None of these scenarios involve a lower interest rate reflecting market expectations that the mortgage rate will go up. (Table 13)
Table 13: Housing activity in Freddie Mac scenarios
| Rate Scenario | Mortgage Rate (bps Change) | Originations (% Change) | Home Sales (% Change) | Housing Starts (% Change) |
|---|---|---|---|---|
| Status Quo | -10 | 5 | 5 | 10 |
| Average | 146 | -30 | -5 | -11 |
| Severe | 238 | -49 | -14 | -32 |
Impacts of Rising VA Funding Fees
We estimate the impact of VA funding fees on loan originations under three different scenarios. Our analytical approach is as follows. First, we consider a set of funding fees for first-time home buyers with no down payment VA-backed loans. Our base case uses the 2019 VA funding fee schedule. We also include three scenarios where the VA funding fee schedule increases by 25 bps, 50 bps, and 100 bps, respectively. Second, we calculate the monthly payment (including principal, interest, and VA funding fee) for a typical median VA home under different funding fee rates outlined in the first step above. Our analysis uses the median VA home price of $257,083 during 2016-18, a 4.00% interest rate, and a 30-year fixed loan. We also assume the funding fee is rolled into the mortgage at the time of purchase. Third, we calculate total dollar amount of the VA funding fee to derive the equivalence of additional interest rate for veteran homeowners. We assume a typical homeowner stays six years in a home, based on the National Association of Realtor’s estimate for 1985-2018. Therefore, total dollar amount of the VA funding fee is amortized over six years. Lastly, we estimate the impact of the VA funding fee, expressed in the equivalence of interest rate, on loan originations. We use Freddie Mac estimates of the impact of mortgage rate on loan originations.
We repeated our analysis under three Freddie Mac scenarios: Status Quo, Average, and Severe. The base case has the 2019 VA funding fee schedule for first-time use with no down payment and subsequent use with no down payment. There are three additional scenarios where the VA funding fee is increased by 25 bps, 50 bps, and 100 bps. (Table 14)
Table 14: VA funding fee for first-time and subsequent use
| - | Base-Case | +25 bps | +50 bps | +100 bps |
|---|---|---|---|---|
| Military | ||||
| - First-time, no down payment | 2.15% | 2.4% | 2.65% | 3.15% |
| - Subsequent, no down payment | 3.30% | 3.55% | 3.80% | 4.30% |
| Reserves/National Guard | ||||
| - First-time, no down payment | 2.40% | 2.65% | 2.90% | 3.40% |
| - Subsequent, no down payment | 3.30% | 3.55% | 3.80% | 4.30% |
Table 15 below shows the monthly payment of a $257,083 mortgage under different VA funding fee schedules. These monthly payments are based on a 4.00% interest rate, 30-year fixed loan, no down payment, and financing of the funding fee to be amortized for 30 years. For example, the monthly payment, including principal, interest, and the VA funding fee, for the first-time military user is $1,254 and for the subsequent military user is $1,268.
If the VA funding fee increases by 25 bps, 50 bps, and 100 bps, monthly payment for the first-time military user will be $1,257, $1,260, and $1,266, respectively.
Table 15: Monthly payment for a median VA home loan (VA funding fee to be amortized over 30 years)
| - | Base-Case | +25 bps | +50 bps | +100 bps |
|---|---|---|---|---|
| Military | ||||
| First-time, no down payment | $1,254 | $1,257 | $1,260 | $1,266 |
| Subsequent, no down payment | $1,268 | $1,271 | $1,274 | $1,280 |
| Reserves/National Guard | ||||
| First-time, no down payment | $1,257 | $1,260 | $1,263 | $1,269 |
| Subsequent, no down payment | $1,268 | $1,271 | $1,274 | $1,280 |
The monthly payment schedules above assume veteran homeowners keep the loans for 30 years. But the national median homeowners historically moved within six years. For those veteran borrowers who roll over the VA funding fee into the principal, they are in effect pay the VA funding fee for the 6-year period of staying in the house. We calculate the total dollar amount of the VA funding fee to be paid over six years to derive monthly payment of a median home. (Table 16) For example, the hypothetical monthly principal and interest payment of a $257,083 mortgage, 4.00% interest rate, 30-year fixed loan, no down payment, with the VA funding fee is $1,254. (Base case, Table 16) The total dollar amount of the VA funding fee for the first-time and no down payment is $5,527 (2.15% of $257,083). After 6 years, the balance of the VA funding fee is $4,880. In effect, the monthly payment is $1,322 ($1,254 + $4,880/72 months).
Table 16: Monthly payment for a median VA home loan (VA funding fee to be paid over 6 years)
| - | Base-Case | +25 bps | +50 bps | +100 bps |
|---|---|---|---|---|
| Military | ||||
| First-time, no down payment | $1,322 | $1,332 | $1,343 | $1,365 |
| Subsequent, no down payment | $1,372 | $1,383 | $1,394 | $1,416 |
| Reserves/National Guard | ||||
| First-time, no down payment | $1,332 | $1,343 | $1,354 | $1,376 |
| Subsequent, no down payment | $1,372 | $1,383 | $1,394 | $1,416 |
We use this monthly payment (VA funding fee to be paid in six years) to calculate the equivalence of additional interest rate for a median home. The equivalent interest rate of a $1,322 monthly mortgage payment is 4.60%. The equivalence of additional interest of this VA funding fee is 60 bps (4.60% - 4.00%). Table 17 calculates the equivalence of the additional interest for veteran borrowers using the 2019 VA funding fee schedule (base case) and other scenarios with higher VA funding rates. For example, the equivalence of interest rate of 3.15% VA funding fee for the first-time and no down payment military users who move in 6 years is 90 bps. In other words, a one-time 100 bps increase of VA funding fee from 2.15% to 3.15% has the same effect on monthly payment as a 90 bps increase in interest rate.
Table 17: The equivalence of additional interest rates of the va funding fee payment
| - | Base-Case | +25 bps | +50 bps | +100 bps |
|---|---|---|---|---|
| Military | ||||
| First-time, no down payment | 60 bps | 70 bps | 75 bps | 90 bps |
| Subsequent, no down payment | 95 bps | 100 bps | 110 bps | 120 bps |
| Reserves/National Guard | ||||
| First-time, no down payment | 70 bps | 75 bps | 85 bps | 95 bps |
| Subsequent, no down payment | 95 bps | 100 bps | 110 bps | 120 bps |
Assuming 80% of veteran borrowers pay VA funding fees, we estimate 548,342 VA loans pay VA funding fees per year (80% of 685,428). Freddie Mac estimated a 146 bps increase in mortgage rate reduced loan originations by 30%. We applied Freddie Mac’s figures to estimate the impact of the VA funding fee on loan originations. For every 10 bps increase in interest rate resulting from the VA funding fee, VA loan originations are reduced by 11,270 (2.05% of 548,322 VA loans with funding fees).
Table 18 shows the reduction in loan originations for different VA funding fees. For example, a 2.15% VA funding fee reduces VA loan originations by 67,604 for first-time and no down payment military home buyers. If the VA funding fee increases by 100 bps to 3.15%, it would reduce loan originations by 101,406. In other words, a one-time 100 bps increase of the VA funding fee has a similar impact of a 90 bps increase in interest rate, which in turn would reduce loan originations by 33,802 (101,406 – 67,604).
Table 18: Reduction in loan originations under the Status-quo scenario
| - | Base-Case | +25 bps | +50 bps | +100 bps |
|---|---|---|---|---|
| Military | ||||
| First-time, no down payment | 67,604 | 78,871 | 84,505 | 101,406 |
| Subsequent, no down payment | 107,039 | 112,673 | 123,940 | 135,208 |
| Reserves/National Guard | ||||
| First-time, no down payment | 78,871 | 84,505 | 95,772 | 107,039 |
| Subsequent, no down payment | 107,039 | 112,673 | 123,940 | 135,208 |
The negative impact of rising VA funding fees on VA loan originations is more significant in the rising interest environment. As in Freddie Mac scenarios, 30-year mortgage rates are expected to rise by 146 bps in the Average scenario and 238 bps in the Severe scenario.
Under the Freddie Mac’s Average scenario, mortgage rates will increase by 146 bps within 13 months. We estimate the current 2.15% VA funding fee under the Average scenario would reduce loan originations of first-time users by 232,107. If the VA raises the funding fee by 100 bps to 3.15%, we estimate loan originations will be reduced by 265,909. (Table 19)
Table 19: Reduction in loan originations under the Average scenario
| - | Base-Case | +25 bps | +50 bps | +100 bps |
|---|---|---|---|---|
| Military | ||||
| First-time, no down payment | 232,107 | 243,374 | 249,008 | 265,909 |
| Subsequent, no down payment | 271,542 | 277,176 | 288,443 | 299,711 |
| Reserves/National Guard | ||||
| First-time, no down payment | 243,374 | 249,008 | 260,270 | 271,542 |
| Subsequent, no down payment | 271,542 | 277,176 | 288,438 | 299,711 |
Under the Freddie Mac’s Severe scenario, mortgage rates will increase by 238 bps within 14 months. We estimate the current 2.15% VA funding fee under the Severe scenario would reduce loan originations of first-time and no down payment users by 335,766. If the VA raises the funding fee by 100 bps to 3.15%, we estimate loan originations will be reduced by 369,568. (Table 20)
Table 20: Reduction in loan originations under the Severe scenario
| - | Base-Case | +25 bps | +50 bps | +100 bps |
|---|---|---|---|---|
| Military | ||||
| First-time, no down payment | 335,766 | 347,033 | 352,667 | 369,568 |
| Subsequent, no down payment | 375,202 | 380,835 | 392,103 | 403,370 |
| Reserves/National Guard | ||||
| First-time, no down payment | 347,033 | 352,667 | 363,934 | 375,202 |
| Subsequent, no down payment | 375,202 | 380,835 | 392,103 | 403,370 |
Conclusion
The U.S. Department of Veterans Affairs provides a mortgage guaranty for veterans to borrow money from private lenders to purchase homes at a competitive rate with no down payment and no mortgage insurance. The program has provided an average of 685,428 VA-backed loans totaling $176.2 billion per year during FY2016-18. We estimate the program, through the mortgages, supports 361,862 jobs across all industries that earn $12.7 billion a year. VA purchase loans generate $47.3 billion in economic activity and contribute $27.6 billion value-added to the U.S. GDP each year.
The majority of mortgage borrowers must pay the VA funding fee to help the program offset losses in the case of borrower default. As shown, the financial impacts of VA funding fees on veteran monthly payments and therefore their ability to purchase homes are similar to mortgage rates. We estimate the current 2.15% VA funding fee (first-time and no down payment) is equivalent to a 60 bps increase in the mortgage rate for veteran borrowers.
Although veteran borrowers historically have lower default and foreclosure rates than their non-veteran counterparts, there are proposals to increase VA funding fees. Increased interest rates reduce loan originations. We use Freddie Mac’s findings on the impact on loan originations to estimate the impact of a 25 bps, 50 bps, and 100 bps increase in the VA funding fee with current mortgage rates. These increases in the funding fee would reduce VA loan originations by 78,871, 84,505, and 101,406, respectively, for first-time veteran borrowers with no down payment. In the environment of rising interest rates, an increase in the VA funding fee would magnify the negative impacts of rising interest rates on loan originations. We use Freddie Mac’s Average and Severe scenarios where mortgage rates increase by 146 bps and 238 bps, respectively. A VA funding fee increase of 25 bps, 50 bps, and 100 bps under the Freddie Mac’s Average scenario would reduce loan originations for VA first-time borrowers with no down payment by 243,374, 249,008, and 265,909, respectively. Under the Severe scenario, a VA funding fee increase of 25 bps, 50 bps, and 100 bps would reduce loan originations for VA first-time borrowers with no down payment by 347,033, 352,667, and 369,568, respectively.
References
- Nam D. Pham is Managing Partner and Mary Donovan is Principal at ndp | analytics. Mortgage Research Center, LLC provided financial support to conduct this study. The opinions and views expressed in this report are solely those of the authors.
- U.S. Department of Veterans Affairs. VA Home Loans.
- U.S. Department of Veterans Affairs. Funding Fee Tables.
- H.R.299 – Blue Water Navy Vietnam Veterans Act of 2019, 116th Congress (2019-2020)
- U.S. Department of Veterans Affairs. Funding Fee Tables.
- H.R.299 – Blue Water Navy Vietnam Veterans Act of 2019, 116th Congress (2019-2020)
- National Association of Realtors.
- U.S. Census. American Community Survey, 2017; Department of Defense’s Military Spouse Demographic and Employment Information: Active Duty Master File, Reserve Common Components Personnel Data System (RCCPDS) File, Appropriated Fund (APF) Civilian Master File.
- U.S. Census. American Community Survey, 2017.
- U.S. Census, American Community Survey, 2017.
- U.S. Census, American Community Survey, 2013-17.
- U.S. Census, American Community Survey, 2014
- U.S. Census, American Community Survey, 2014
- National Association of Realtors and Statista.
- U.S. Department of Veterans Affairs. VA Home Loans, Lender Statistics.
- U.S. Department of Veterans Affairs. VA Home Loans, Lender Statistics.
- Mortgage Bankers Association. National Delinquency Survey.
- Mortgage Bankers Association. National Delinquency Survey.
- U.S. Department of Veterans Affairs. VA Home Loans, Lender Statistics.
- National Association of Realtors. The Economic Impact of a Typical Home Sale. https://www.nar.realtor/sites/default/files/documents/2018-state-economic-impact-of-real-estate-activity-us-06-06-2019.pdf
- U.S. Department of Veterans Affairs. VA Home Loans, Lender Statistics.
- National Association of Realtors. The Economic Impact of a Typical Home Sale. https://www.nar.realtor/sites/default/files/documents/2018-state-economic-impact-of-real-estate-activity-us-06-06-2019.pdf
- Total economic impacts of construction exclude a typical 6% realtor commission. The 6% realtor commission is part of the 9% expenditures by homeowners to purchase an existing or a new home.
- Freddie Mac. 2018. “Nowhere to Go But Up? How Increasing Mortgage Rates Could Affect Housing.” Economic & Housing Research Insight.
- Freddie Mac. 2018. “Nowhere to Go But Up? How Increasing Mortgage Rates Could Affect Housing.” Economic & Housing Research Insight.
- Freddie Mac. 2018. “Nowhere to Go But Up? How Increasing Mortgage Rates Could Affect Housing.” Economic & Housing Research Insight.

Related Posts
-
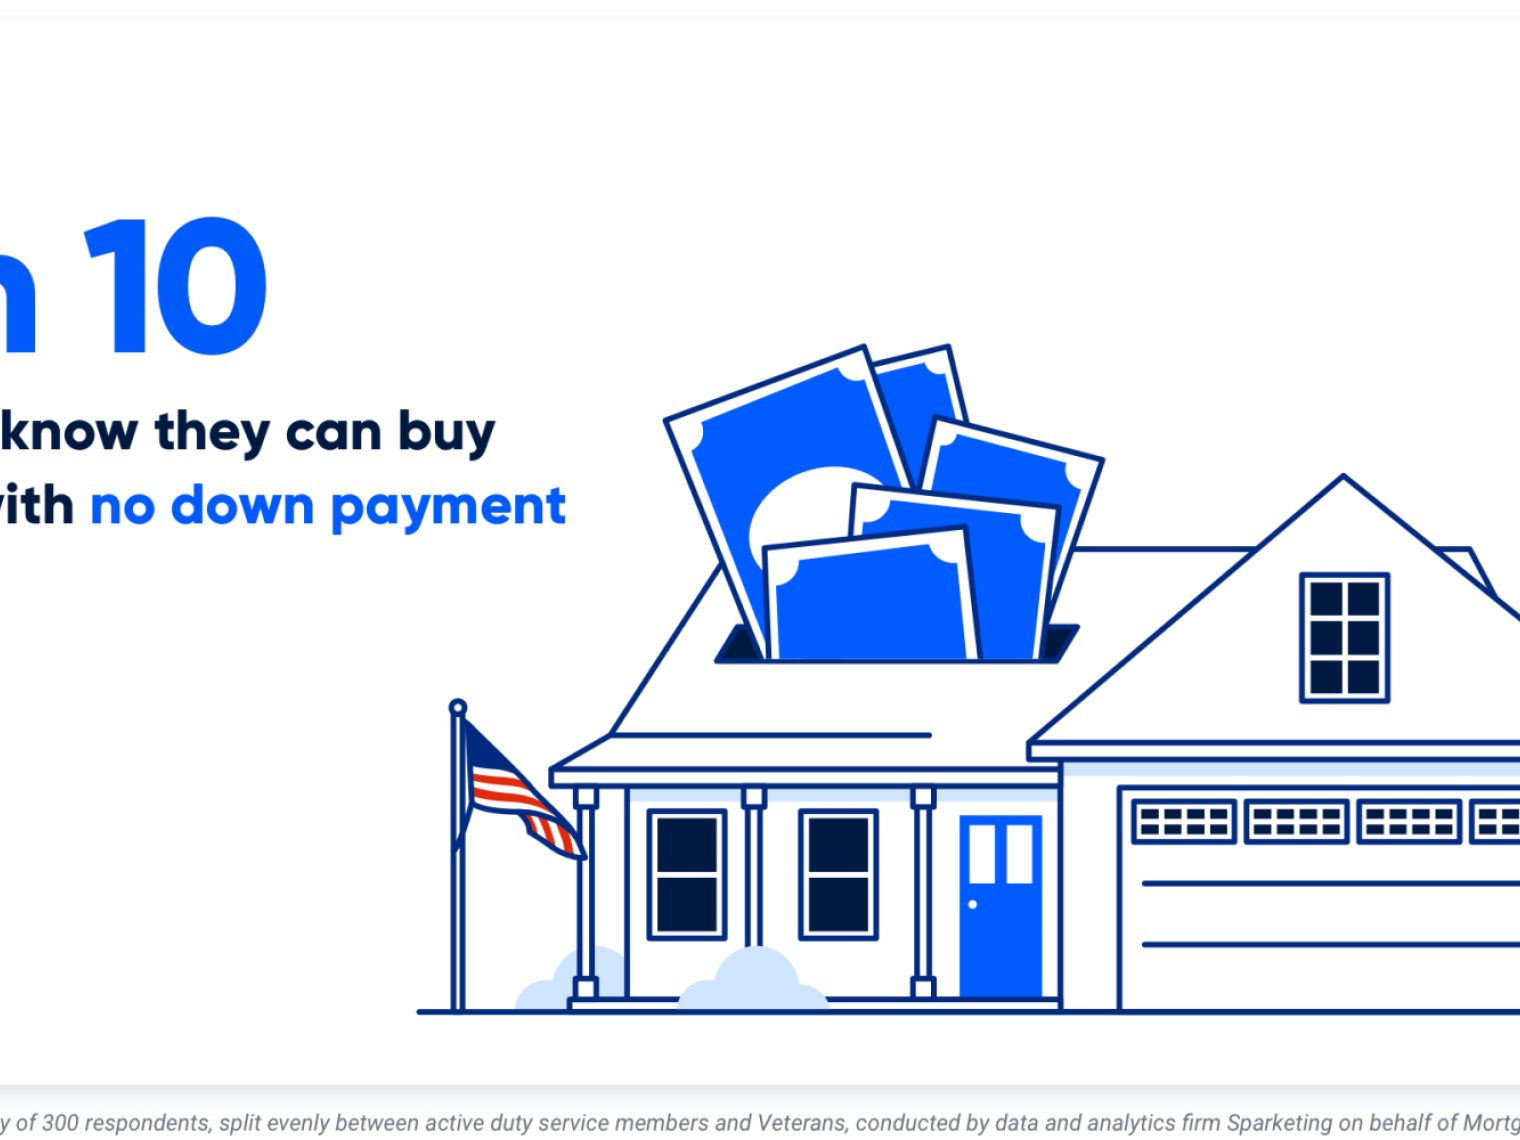 VA Loan Down Payment RequirementsVA loans have no down payment requirements as long as the Veteran has full entitlement, but only 3-in-10 Veterans know they can buy a home loan with zero down payment. Here’s what Veterans need to know about VA loan down payment requirements.
 -
 5 Most Common VA Loan Myths BustedVA loan myths confuse and deter many VA loan borrowers. Here we debunk 5 of the most common VA loan myths so that you can borrow with confidence.


